Big Picture
The Rich (unsurprisingly) travel more
As the pandemic brought travel to a screeching halt it is interesting to take a look at the trends of travel to the United States pre-pandemic. In taking a look at pre-pandemic flights between 1990 and 2019 we see a few things come to the forefront.
As the GDP of a country increases we see that the total number of passengers from that country also increases:
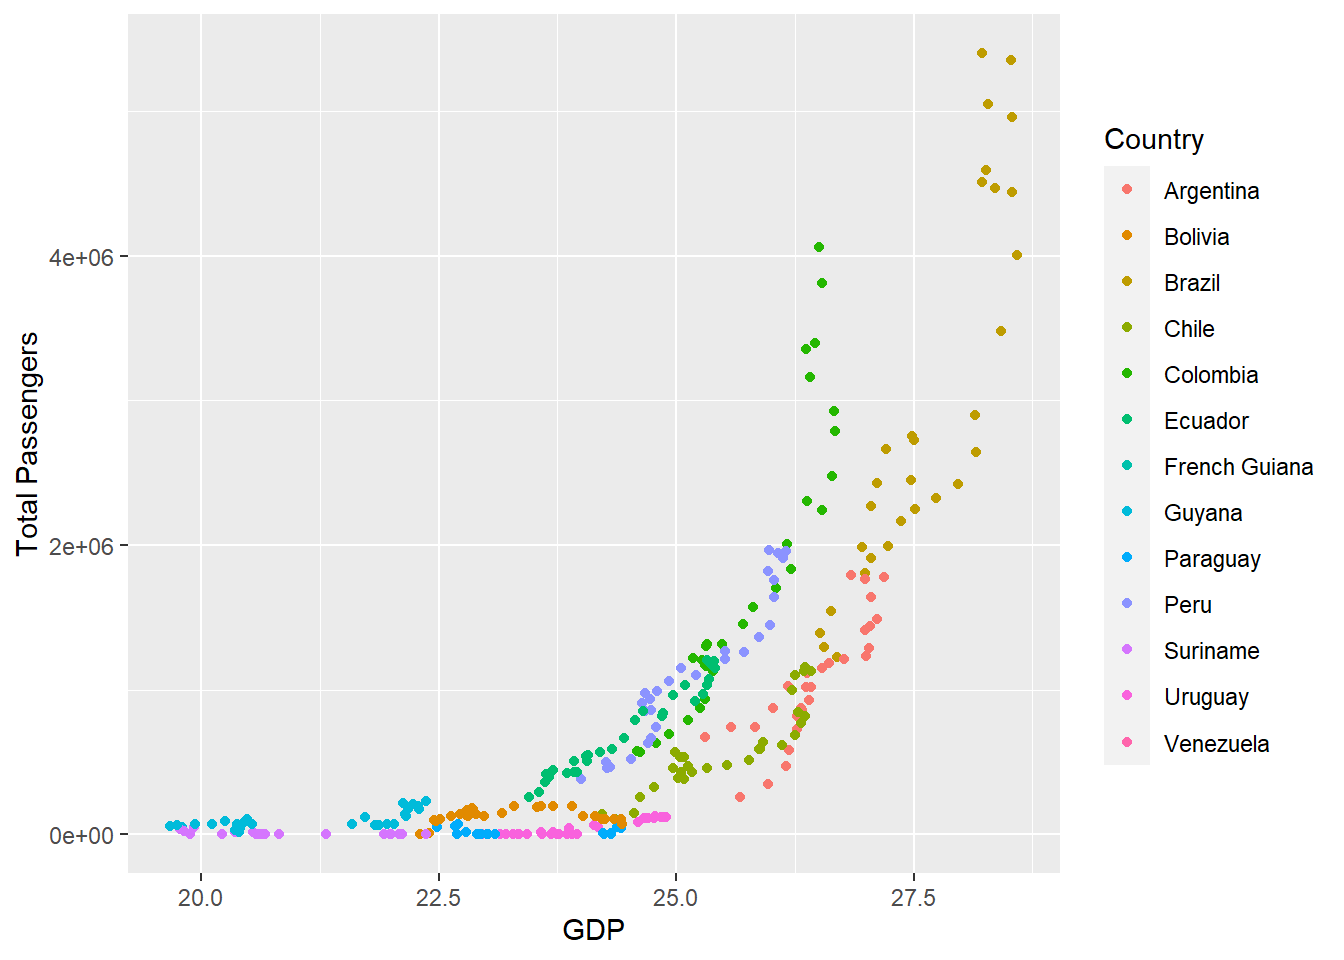
As we see in the graph by looking at countries in South America, we see a huge increase in the number of passengers a country has as its GDP increases. Keeping all of the countries in the same continent controls for the distance between the different countries. Despite this, the upward trend in the plot shows that there is a clear positive relationship between GDP and total passengers traveling to and from the United States. For example, the orange colored dots of Brazil shows us that as a country gets richer it’s total passengers increase as well.
We see this relationship occur around the world with countries much further from each other and the United States as well. China is a great example of the same relationship displayed by Brazil. Namely that as a country gets richer it also has more passengers travel to and from the United States.
The following graph shows the GDP vs total passengers for the countries with highest GDP growth in 2019, and exemplifies China as it has one of the most passengers as well as highest GDPs.

Overall, we see that as a country’s economy grows, the amount of travel to and from the United States to said countries grows in comparison. Although we cannot conclude that this relationship is directly causal and a country’s economy is the strict factor in its airport traffic, the data in this project shows a clearly significant relationship between the two.