First load and clean the data
library(tidyverse)## -- Attaching packages --------------------------------------- tidyverse 1.3.1 --## v ggplot2 3.3.5 v purrr 0.3.4
## v tibble 3.1.6 v dplyr 1.0.7
## v tidyr 1.1.4 v stringr 1.4.0
## v readr 2.1.1 v forcats 0.5.1## -- Conflicts ------------------------------------------ tidyverse_conflicts() --
## x dplyr::filter() masks stats::filter()
## x dplyr::lag() masks stats::lag()source(
here::here("static", "load_and_clean_data.R"),
echo = FALSE
)## Rows: 698351 Columns: 16## -- Column specification --------------------------------------------------------
## Delimiter: ","
## chr (5): data_dte, usg_apt, fg_apt, carrier, type
## dbl (11): Year, Month, usg_apt_id, usg_wac, fg_apt_id, fg_wac, airlineid, ca...##
## i Use `spec()` to retrieve the full column specification for this data.
## i Specify the column types or set `show_col_types = FALSE` to quiet this message.Plotting the data:
The first plot shows the total passengers over the timeframe in the data for airports with greater than 100 million total passengers.
plane_data_clean %>% group_by(US_Airport) %>% summarize(n = sum(Total)) %>% filter(n >= 100000000) %>% ggplot(aes(US_Airport, n)) + geom_col() + labs(y = "Count")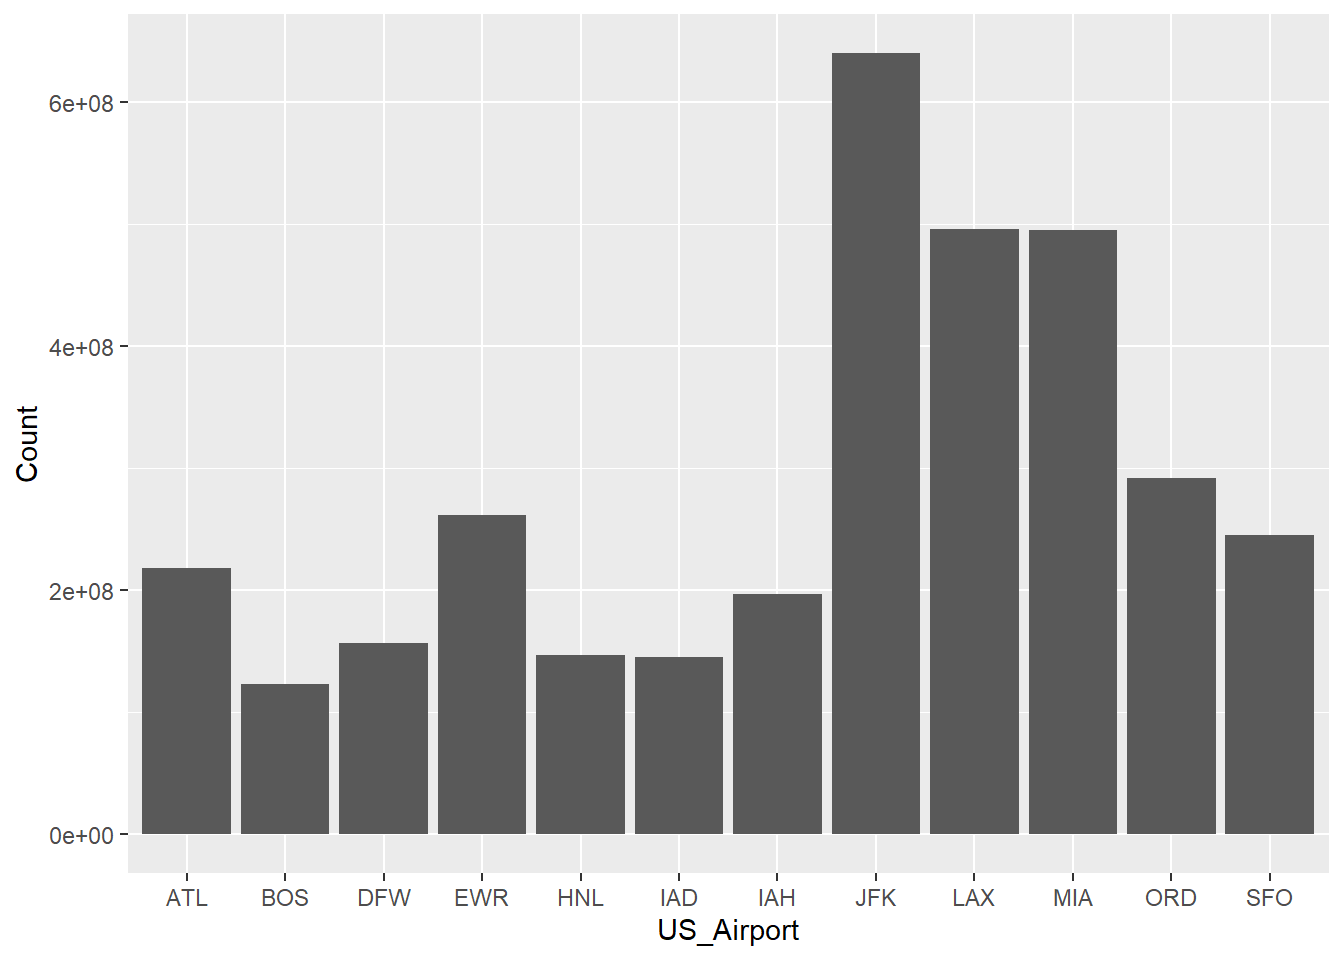
The second plot shows the total passengers per month of the year, showing that the summer months have the most foreign passengers.
plane_data_clean %>% group_by(Month) %>% summarize(n = sum(Total)) %>% filter(n >= 100000000) %>% ggplot(aes(as.factor(Month), n)) + geom_col() + labs(x = "Month", y = "Frequency")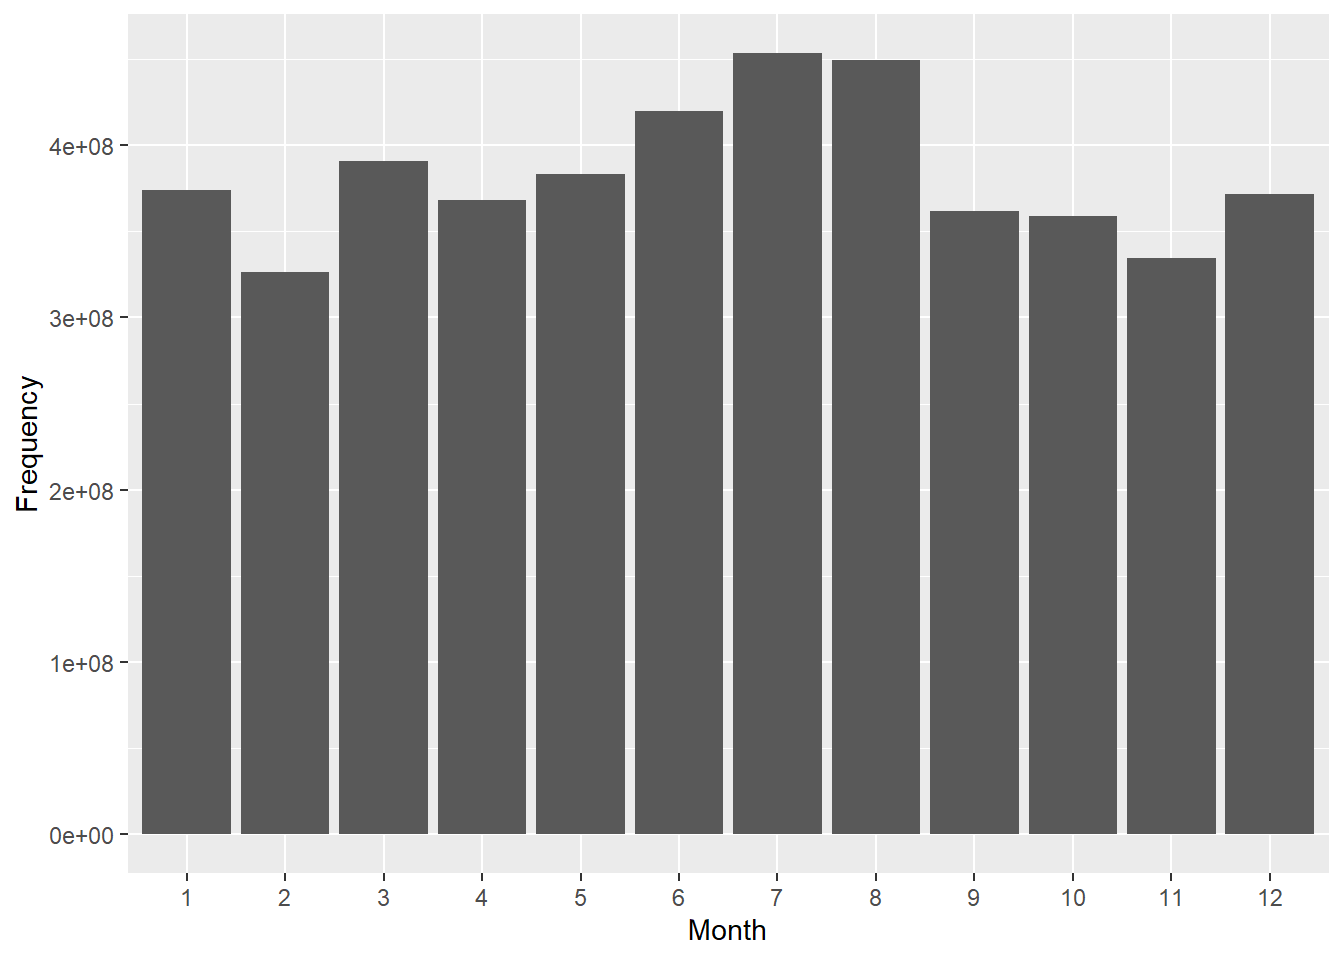
Summary statistics for key quantitative variables
summary(plane_data_clean$Scheduled)## Min. 1st Qu. Median Mean 3rd Qu. Max.
## 0 137 3428 6385 9550 149898summary(plane_data_clean$Charter)## Min. 1st Qu. Median Mean 3rd Qu. Max.
## 0.0 0.0 0.0 192.6 0.0 58284.0summary(plane_data_clean$Total)## Min. 1st Qu. Median Mean 3rd Qu. Max.
## 1 597 3670 6577 9610 150195These summaries display the statistics for Scheduled, Charter and Total number of passengers. Here we can see that the average charter passengers per month is extremely low at an average of 192. A vast majority of most passengers within the dataset are composed of regularly Scheduled flights. One month of data collection saw over 150,000 total passengers, however the average is 6,577 flights per month of data collected.
Data Equity Analysis:
Our dataset comes from the Department of Transportation, with public access available on data.gov as well as other redirections from the Department of Transportation website. This dataset is arguably very objective and quantitative, it does not include any descriptive measurements or means of personal identification. The data collected is simply the number of passengers that boarded planes at airports, and the foreign airport they flew to. As long as individuals who fly consent to being measured as a passenger, that is the only personal aspect of this dataset. We believe that as far as beneficence is concerned, this dataset does much more harm than good. It simply displays the number of international passengers by date, location, and foreign destinations. This allows for transportation departments to properly plan and allocate resources to busier time periods through data study, and with public access an informed traveler could discover low-profile periods to travel internationally. The only harm that could be foreseen from this dataset is that patterns about dates in which passenger counts are high could be created by someone with negative interests in mind, and that could potentially lead to some unneeded danger. This dataset does not portray any group of people or community in any specific way, nor are individuals involved at all apart from merely being used as a passenger count. All persons and groups should be under equal consideration under this dataset, and no separative measures are implemented. As stated previously it is very hard to misuse or interpret this government dataset as it is quite impersonal and purely logistically based, aside from potential attacks in high volume periods. The data is objective enough where it would be hard for anyone observing it to form any conceptions or misrepresentations about it. It is merely an observational dataset created by the DOT to monitor international passenger traffic over the years. As far as the plans for our use of the data and overall transparency, it is hard to create something negative from this data. We also plan to incorporate other datasets to deal with our limitations of analysis, such as the lack of descriptive information and variables. As stated before this dataset is very quantitative and objective, so overall analysis within just this set may be slightly limited when it comes to determining trends and correlational patterns.